
An interesting poster has recently been published by XenoTech: “Selection of Human Liver S9 and Cytosol Fractions for Evaluating Clearance by Aldehyde Oxidase (AO): The Impact of Low Versus High AO Activity Lots” by Phyllis Yerino, Clayton Otwell, Zell Woodworth and David B Buckley (XenoTech, LLC, Lenexa, KS, USA).
Introduction
Aldehyde oxidase (AO) is a cytosolic enzyme present in the liver of humans and other mammals that catalyzes various oxidation and reduction reactions. Biotransformation by AO is an important clearance mechanism for many drugs and drug candidates, with increasing importance in certain chemical spaces, and in some cases, such as zaleplon, AO metabolism leads to rapid in vivo clearance. Several publications have demonstrated the under-prediction of in vivo human clearance from in vitro clearance data, which are typically conducted with human liver subcellular fractions, such as S9 or cytosol.
Zientek and colleagues (2010) described a rank order approach, or ‘yard-stick’ approach, to categorize known AO substrates into low, medium or high clearance categories based on in vitro CLint data. With this approach, new drugs candidates can be evaluated in vitro in S9 or cytosol and the predicted in vivo clearance can be qualitatively evaluated. These subcellular fractions, S9 and cytosol, are commercially available from multiple sources and in many formats (individuals and pools of various sizes), which leads to variation in AO activity.
Because of the necessity to scale AO clearance with a rank-order approach, the present study set forth to determine which human liver S9 and cytosol lots (individual or pooled) can be utilized to predict AO clearance once threshold values are determined with appropriate probe drugs. Therefore, this study evaluates the impact of low versus high AO activity in human liver S9 and cytosol preparations on the prediction of scaled clearance for AO substrates with the ‘yard-stick’ approach.
Methods
If you’re interested in the methods used, copies of the poster can be requested.
[contact-form to=’jean-francois.tetu@tebu-bio.com’ subject=’Poster AO – Blog’][contact-field label=’Email’ type=’email’ required=’1’/][/contact-form]
Results

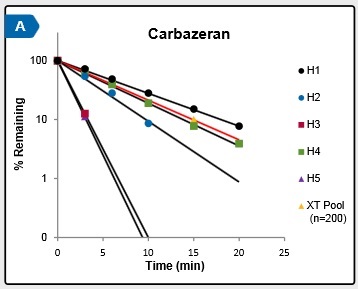
Figure 1. Metabolic stability (clearance) of the AO substrates carbazeran, zoniporide and zaleplon in individual (five) and pooled (n = 50) human liver cytosol fractions
Figure 1 illustrates the metabolic clearance of carbazeran, zoniporide and zaleplon in individual (five) and pooled (n =50) human liver cytosol fractions. The in vitro clearance of carbazeran (Figure 1A), a high clearance AO substrate, increased in accordance to the rank order previously determined for phthalazine oxidation (Table 1). Across the range of individuals, the half-life of carbazeran ranged from 0.6 to 36 minutes. In pooled cytosol, the observed half-life of carbazeran was four minutes which was similar to the median individual sample.
 Table 1. Rank order of AO activity in various individual and pooled human liver cytosol fractions as determined by in vitro half-life
In a similar manner, the in vitro clearance of zoniporide (Figure 1B), a moderate clearance AO substrate, increased in accordance to the rank order previously determined for phthalazine oxidation (Table 1). Across the range of individuals,
the half-life of zoniporide ranged from 19 to >240 minutes. In pooled cytosol, the observed half-life of zoniporide was 89 minutes which was similar to the median individual sample.
The in vitro clearance of zaleplon (Figure 1C), a low clearance AO substrate, increased in accordance to the rank order previously determined for phthalazine oxidation (Table 1). Across the range of individuals, the half-life of zaleplon ranged from 108 to >240 minutes. In pooled cytosol, the observed half-life of zaleplon was >240 minutes which was similar to the median individual sample.
High, moderate and low clearance drugs (Table 1) could be segregated based on the observed half-life in all cytosol samples (individual and pooled) with the exception of the lowest activity individual (H1)

Figure 2. Metabolic stability (clearance) of the AO substrates carbazeran, zoniporide and zaleplon in individual (five) and pooled (n = 200) human liver S9 fractions
Figure 2 illustrates the metabolic clearance of carbazeran, zoniporide and zaleplon in individual (five) and pooled (n =200) human liver S9 fractions. The in vitro clearance of carbazeran (Figure 2A), a high clearance AO substrate, increased in accordance to the rank order previously determined for phthalazine oxidation (Table 2). Across the range of individuals, the half-life of carbazeran ranged from 1 to 6 minutes. In pooled S9, the observed half-life of carbazeran was 5 minutes which was similar to the H2 individual sample.

Table 2. Rank order of AO activity in various individual and pooled human liver S9 fractions as determined by in vitro half-life
In a similar manner, the in vitro clearance of zoniporide (Figure 2B), a moderate clearance AO substrate, increased in accordance to the rank order previously determined for phthalazine oxidation (Table 2). Across the range of individuals, the half-life of zoniporide ranged from 21 to 104 minutes. In pooled S9, the observed half-life of zoniporide was 74 minutes which was similar to the H2 individual sample.
The in vitro clearance of zaleplon (Figure 2C), a low clearance AO substrate, increased in accordance to the rank order previously determined for phthalazine oxidation (Table 2). Across the range of individuals, the half-life of zaleplon ranged from 86 to >120 minutes. In pooled S9, the observed half-life of zaleplon was >120 minutes which was similar to the median individual sample.
High, moderate and low clearance drugs (Table 2) could be segregated based on the observed half-life in all S9 samples (individual and pooled).
Conclusion
In human liver S9, half-lives and scaled clearance could be calculated from all five individuals, including the lowest activity sample. In each case the ‘yard-stick’ approach could be applied to all samples tested with reasonable thresholds, including the lowest and highest activity donors representing over a 10-fold range in AO activity.
In human liver cytosol, half-lives and scaled clearance could be calculated from four of five individuals, the exception being the lowest AO activity sample. Similarly, the ‘yard-stick’ approach could be applied with reasonable thresholds for all samples tested, except for the lowest AO activity sample.
These data indicate that, because of the necessity to scale AO clearance with a rank-order approach, nearly all human liver S9 and cytosol lots (individual or pooled) can be utilized to predict AO CLint once threshold values are determined with appropriate probe drugs.
Reference
Zientek et al., Drug Metab Dispos 38:1322-1327, 2010
Microsomes, S9, cytosol or hepatocytes…
Please send an e-mail to adme@tebu-bio.com to discuss your project with our experts.


