The detection of molecular events in living cells is booming. In this post, we look at 3 fluorescent probes that will undoubtedly count in the live-cell imaging landscape in 2017.
The use of fluorescent probes for detecting and monitoring cellular and molecular events in living cells is becoming more and more popular.

This year was marked by the launch of numerous innovative fluorescent probes covering various areas, such as:
These new tools complement an already comprehensive offer of well-accepted dyes such as SiR fluorogenic probes for studying cytoskeletal dynamics, DNA or monitoring lysosomal activities, ROSFluor™ Series for the measurement of reactive oxgen species, and NOFluor™ Series for NO monitoring, Fluo-8 and other probes for Calcium concentrations….
To illustrate the dynamism of this offer, an interactive cellular map has been designed for the convenient selection of fluorescent dyes according to the cellular parameter to analyse in live cell imaging (LCI) or flow cytometry (FCM).
What does the future hold?

2017 will also see the emergence of promising and innovative fluorescent probes that will bring Life Scientists reliable tools to further analyze events in living cells. Here are 4 dyes that will count.
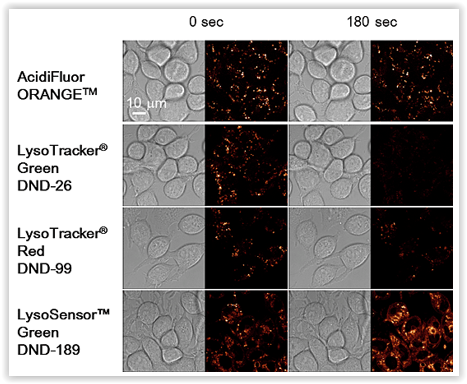
#1 – AcidiFluor Orange: probe acidic organelles
AcidiFluor™ stains are photostable Orange fluorescent dyes with high S/N ratio to selectively stain acidic cellular organelles:
- AcidiFluor™ ORANGE (cat. nr GC301): pH probe for acidic organelle imaging,
- AcidiFluor™ ORANGE-NHS (cat. nr GC302): pH probe for labeling protein and nucleic acid,
- AcidiFluor™ ORANGE-Zymosan A (cat. nr GC305): For analyzing phagocytosis,
- AcidiFluor™ ORANGE-Dextran 10K (cat. nr GC306) and -transferin (cat. nr GC309) for endocytosis detection.
AcidiFluor™ stains enable thus the monitoring of exocytosis, endocytosis, pH dynamics in vesicule in living cells, and are compatible with multicolor imaging.

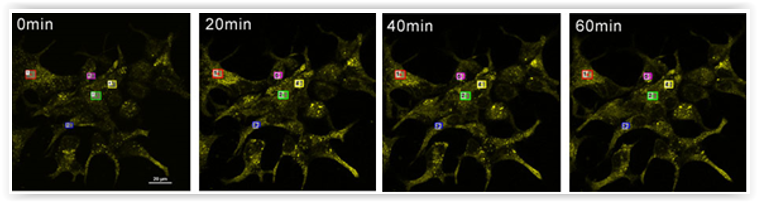
#2 – GlycoYELLOW™-βGal to screening of β-galactosidase activity in live cells
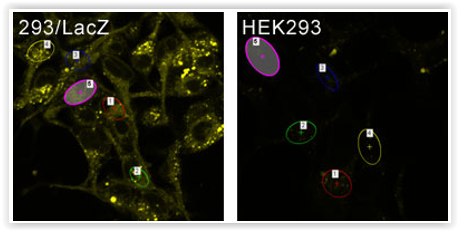
β-galactosidase (β-Gal) activity is widely used as a senescent marker (SA-βGal) or reporter gene such as lacZ (transfection efficiency, gene reporter assays, transcriptional regulation…).
For more biologically relevant lacZ analysis by fluorescent imaging, the GlycoYELLOW™-βGal (cat. nr GC601) has been recently released. This dye probes for β-Gal activity at single-cell level detection with high S/N ratio for both live and fixed cells.
Therefore, it is suitable for pharmacological screening tests, including cell imaging-based screening system as well as detection of cellular senescence.

#3- MAR – the hypoxia detection probe

Hypoxia occurs in living tissue and is closely related to various diseases such as cancers and ischemia.
Current hypoxia detection probes (e.g. pimonidazole) require immunostaining of fixed cells. HypoFluor™ MAR fluorogenic probe (cat. nr A101-01) is a new hypoxia detection probe easily applicable for live-cell imaging and flow cytometry with an high level of sensitivity.
MAR is becoming fluorescent (Ex. 498 nm / Em. 520 nm) while hypoxic conditions are appearing (pO2 of about 5%) in cell culture or in tissues


What about you?
Which fluorescent probes will you use in 2017? Which cellular parameters are you studying or do you plan to study in the coming months?
Share your comments below!
 Interested in learning more about tools like this?
Subscribe to thematic newsletters on your favourite research topics.