
For one year now, SiR-Actin and SiR-Tubulin, the second generation of tools to stain actin and tubulin in living cells, have been available on the market – and although it may sound like an overstatement, these stains have changed the world of Live Cell Imaging.
For the first time, SiR-stains allow you to visualize actin and tubulin in living cells without the need to transfect cells with vectors carrying the information for fluorescently labelled cytoskeletal proteins or binding proteins, or to restrict yourself to single-cell experiments by micro-injecting fluorescent actin or tubulin. Furthermore, SiR-stains show excellent brightness and have no toxic effects on target cells when used in the concentration range recommended.
Live Cell Imaging – see user’s results with SiR-Actin and SiR-Tubulin
A number of users have kindly provided their results with either SiR-Actin or SiR-Tubulin, proving their broad applicability.

Salivary glands, tracheal branches and the hindgut from 3rd instar Drosophila melanogaster larvae were dissected and the samples were stained with SiR-Actin or Tubulin. Hoechst 33258 was used for additional staining of nuclei. Directly after staining the samples were visualized with a Cell Observer SD system (Carl Zeiss). Fig. 1 shows a staining of the hind gut with SiR-Actin (Courtesy of AG Thomas Magin, University of Leipzig, Germany).

A laboratory at the NIH (Bethesda,US) conducted SiR-Tubulin stainings of single isolated goldfish retinal bipolar cells (Fig. 2). The color spectrum represents depth. Microtubules can be seen to extend from the tips of the dendrites (top) into the axon and down into the giant synaptic terminal (bottom). A loop of microtubules encircles the inner plasma membrane of the terminal (Courtesy of Justin W. Taraska, Laboratory of Cellular Biophysics, NIH, Bethesda, for more details see reference list: A marginal band of microtubules….).
We would like to thank the users who provided these brilliant pictures and results!
Looking for additional SiR stain user’s results in Live Cell Imaging?
Here is a slecteion of the latest publications using SiR-stains.
More and more results have been published over the past months using the SiR-stains and showing their applicability on miscellaneous cell and tissue samples and in diverse microscopic set-ups:
- “Fluorogenic probes for live-cell imaging of the cytoskeleton”; G. Lukinavičius, L.Reymond, E. D’Este, A. Masharina, F. Göttfert, H. Ta, A. Güther, M. Fournier, S. Rizzo, H. Waldmann, C. Blaukopf, C. Sommer, D. W. Gerlich, H.-D. Arndt, S. W. Hell & K. Johnsson; Nature Methods 11, 731–733, 2014.
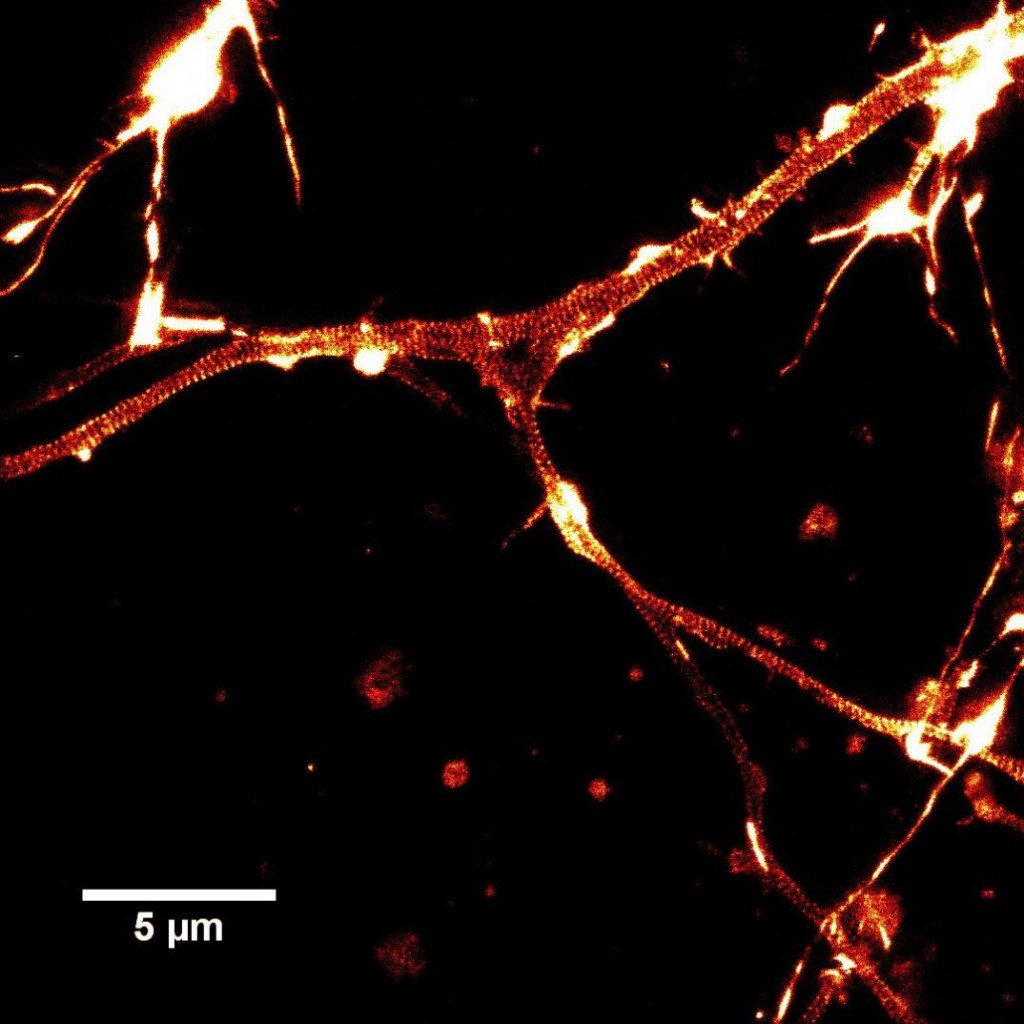
- “STED Nanoscopy Reveals the Ubiquity of Subcortical Cytoskeleton Periodicity in Living Neurons”; E. D’Este, D. Kamin, F. Göttfert, A. El-Hady, S. W. Hell; Cell Reports , Volume 10 , Issue 8 , 1246 – 1251, 2015 (stains made in this lab are shown in Fig 3).
- “A near-infrared fluorophore for live-cell super-resolution microscopy of cellular proteins”; G. Lukinavičius, K. Umezawa, N. Olivier, A. Honigmann, G. Yang, T. Plass, V. Mueller, L. Reymond, I. R. Corrêa Jr, Z. Luo, C. Schultz, E. A. Lemke, P. Heppenstall, C. Eggeling, S. Manley & K. Johnsson; Nature Chemistry 5, 132–139, 2013.

- Fig 3: STED image of cultured rat hippocampal neurons stained with SiR-Actin. Actin rings (stripes) with 180 nm periodicity can be seen. Courtesy of Elisa D’Este, MPI Biophysical Chemistry, Goettingen.
- “Dynamic actin filaments control the mechanical behavior of the human red blood cell membrane”; D. S. Gokhin, R. B. Nowak, J. A. Khoory, A. de la Piedra, I. C. Ghiran and V. M. Fowler; Mol. Biol. Cell; February 25, 2015.
- “A marginal band of microtubules transports and organizes mitochondria in retinal bipolar synaptic terminals”; M. Graffe, D. Zenisek, and J. Taraska; J. Gen Physiol. Vol. 146 No.1: 109-117, 2015.
- “A cleavable cytolysin-neuropeptide Y bioconjugate enables specific drug delivery and demonstrates intracellular mode of action”; V. M. Ahrens, K. B. Kostelnik, R. Rennert, D. Böhme, S. Kalkhof, D. Kosel, L. Weber, M. von Bergen and A. G. Beck-Sickinger; J. Control. Release; 209:170-178, 2015.
- “Red Si–rhodamine drug conjugates enable imaging in GFP cells”; E. Kim, K. S. Yang, R. J. Giedt and R. Weissleder; Chem. Commun., 50, 4504-4507, 2014.
- “Genetic Code Expansion Enables Live-Cell and Super-Resolution Imaging of Site-Specifically Labeled Cellular Proteins”; C. Uttamapinant , J. D. Howe , K. Lang , V. Beránek , L. Davis , M. Mahesh , N. P. Barry , and J. W. Chin; J. Am. Chem. Soc., 137 (14), pp 4602–4605, 2015.
- “Direct Interaction of CaVβ with Actin Up-regulates L-type Calcium Currents in HL-1 Cardiomyocytes”; Gabriel Stölting, Regina Campos de Oliveira, Raul E. Guzman, Erick Miranda-Laferte, Rachel Conrad, Nadine Jordan, Silke Schmidt, Johnny Hendriks, Thomas Gensch, and Patricia Hidalgo, J Biol Chem, 290, 4561-4572 (2015).

Researchers who would like to test the SiR stains in their laboratory are invited to get in touch through the form sheet below, or with their local tebu-bio office in Europe.


