


Apoptosis is the most prominent process of programmed cell death (for an overview see Fig. 1). Biochemical events lead to characteristic cell changes and death. These changes include blebbing, cell shrinkage, nuclear fragmentation, chromatin condensation, and chromosomal DNA fragmentation. Furthermore, changes affecting the membrane, nucleus, cytoplasm, and mitochondria occur. Apoptosis involves a complex cascade of reactions regulated by specific proteases called caspases (take a look at previous posts on Caspases as pharmaceutical targets – how to screen for inhibitors?), and results in DNA degradation. Apoptotic processes have been researched in an extensive variety of diseases. Excessive apoptosis causes atrophy, whereas an insufficient amount results in uncontrolled cell proliferation, such as cancer.
Besides apoptosis other types of programed cell death are known, such as autophagy (see How to manipulate and measure Autophagy?), necroptosis, and ferroptosis (look out for an imminent post I’ll be doing about this iron-dependent form of cell death very shortly, as well as tools to differentiate between apoptois, necroptosis, autophagy, and ferroptosis).
In this post, let’s take a look at methods and kits allowing to measure early apoptotic events.
Methods to measure early apoptosis
The onset of the execution phase of apoptosis can be linked to translocation of phosphatidylserine from the interior to the exterior surface of the mammalian cell membrane.
Two different assay types are available to measure this process.
Direct measurement of translocation of phosphatidylserine
Choline phospholipids make up most of the lipid in the extracellular membrane.
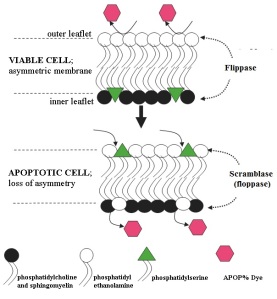
This organisational composition is essential for the normal functions of a viable cell, including the insertion of protein receptors and transporters between the phospholipid molecules. Maintaining the asymmetric composition is an energy dependant process involving the activity of enzymes, termed “flippases”.
In apoptotic committed cells flippase regulation is either overwhelmed, or is inactivated by the activity of the enzyme “scramblase” (floppase) (see Fig 2).
The Apopercentageassay kit utilizes the fact that in early apoptotic cells, phosphatidylserine appears in the outer leaflet of the cell membrane thus allowing a specific dye (APOP% dye) to bind to and enter the cell (Fig. 2).
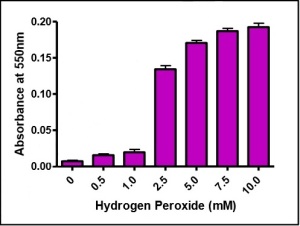
The uptake of the dye is uni-directional, leading to dye accumulation within the cell. The dye accumulation can be finally measured with a microplate colorimeter (Fig. 3) and followed with a microscope (Fig. 4).
-

Fig. 4: Incubation of 3T3 cells with 5 mMHydrogen Peroxide for different periods.

Measurement of Annexin V binding to apoptotic cells
Annexin V based apoptosis assays are based on the same principle as the Apopercentage kit described above.
Phosphatidylserine appears on the surface of early apoptotic cells, and as Annexin V has a high affinity for this specific phospholipid. It can be easily detected by staining for instance with a fluorescent conjugate of Annexin V or by biotinylated Annexin V and subsequent detection by conventional dye-staining using any streptavidine- or avidin-dye reagents (Fig. 5).
Apoptosis related cell based caspase assays

Several caspases are involved in initiation and downstream processes of apoptosis (others play a critical role as mediators of innate immune responses).
Apoptose related caspases can be divided into Initiator caspases (caspase-8, and -9) and executioner caspases (caspase-3, -6, and -7).
Initiator caspases are activated by dimerization of inactive procaspase monomers, while executioner Caspases have to be cleaved and thus activated by initiator caspases.
Executioner caspase exists as procaspase dimers which upon cleavage and subsequent conformational change results in the mature and active enzyme.
The activated executioner caspases finally lead to destruction of key structural proteins and activate other enzymes.
Thus in-cell caspase activation can be used as an indicator of the initiation of the apoptotic process. Furthermore, assays measuring the in-cell activation of caspases can be used to distinguish apoptosis from necrosis.
You’ll find the range of kits (see exemplary results in Fig. 6) for whole cell detection of caspase activity in apoptotic cells on the following links:
- Initiator Caspases 8 and 9

Fig. 6. Jurkat cells were either treated with DMSO (negative, non-induced cells – left) or with staurosporine (apoptotic, induced cells – right) for 2 hours at 37°C. Cells were labeled with FAM-VAD-FMK (detection compound used in the poly caspase detection kit) solution for 60 minutes at 37°C and read on a 96-well fluorescence plate reader. As the caspases became more active, indicating apoptosis, the amount of green fluorescence increased by over 500% in the induced Jurkat cells. - Executioner Caspases 3, 6, and 7
In one of my next posts, I’ll go into these cell based caspase assays in more detail.
Assays to measure the disruption of the mitochondrial transmembrane potential
Assay to measure Cytochrome c release from mitochondria to the cytosol
Multi-Parameter Apoptosis Assay Kit

And finally, there is a kit combining the strong points of divers methods to detect early apoptosis.
The Multi-Parameter Apoptosis Assay Kit employs FITC-conjugated Annexin V as a probe for phosphatidylserine on the outer membrane of apoptotic cells, TMRE as a probe for mitochondrial membrane potential, 7-AAD as an indicator of membrane permeability/cell viability, and Hoechst Dye to demonstrate nuclear morphology. The kit allows phenotypic characterization of different cell death parameters at a single-cell level.
- Besides a wide range of kits for the measurement of early apoptosis, there is a wide range of factors regulating apoptosis in a positive or negative way. We summarized this in the post: Specific cytokines & growth factors in… apoptosis!
- Furthermore, there is also a variety of apotosis modulators.


